Analysis and improvement of the finite element simulation with Inventor of 3D-printed PLA parts
Análisis y mejora de la simulación por elementos finitos con Inventor de piezas de PLA obtenidas por impresión 3D
Iván Prada (1) y Manuel Domínguez (1)
Resumen
El modelado por deposición fundida (MDF) es un proceso de fabricación aditiva capa a capa por el que se obtienen piezas de naturaleza anisotrópica. Debido a este comportamiento, es difícil predecir la respuesta mecánica de las piezas obtenidas una vez que están sometidas a esfuerzos exteriores. La tendencia actual es utilizar las piezas obtenidas por MDF no solo como prototipos estéticos o visuales, sino como piezas completamente funcionales. Se ha observado que de los diversos parámetros que influyen en la respuesta mecánica de las piezas obtenidas por impresión 3D, el relleno interior desempeña un papel fundamental. El uso de programas de análisis por elementos finitos para la simulación de modelos que incluyan la compleja geometría de relleno interior requiere de un alto tiempo de elaboración del modelo virtual, potentes medios técnicos y mucho tiempo de análisis, sin tener garantías de una predicción correcta del comportamiento de la pieza. En este artículo, mediante la combinación de técnicas experimentales y de simulación, se propone una metodología para simplificar el proceso de modelado y análisis por elementos finitos, que permite ajustar los parámetros de la simulación a unos valores, en función de la geometría de relleno interior, que dan como resultado una predicción precisa del comportamiento de piezas impresas en PLA sometidas a flexión.
Palabras clave
Fabricación aditiva, impresión 3D, modelado por deposición fundida, geometría de relleno, propiedades de flexión, análisis por elementos finitos.
Abstract
Fused deposition modelling (FDM) is a layer-by-layer additive manufacturing process, by which we obtain parts of an anisotropic nature. Due to this behaviour, it is difficult to predict the mechanical response of the parts obtained once they are subjected to external stresses. The current trend is to use the parts obtained by MDF not only as aesthetic or visual prototypes, but also as fully functional parts. It has been observed that of the various parameters that influence the mechanical response of 3D printed parts, the internal filling plays a fundamental role. The use of finite element analysis programs for the simulation of models that include the complex geometry of the internal filling requires a long time for the elaboration of the virtual model, powerful technical means and a long analysis time, with no guarantee of a correct prediction of the behaviour of the part. In this article, by combining experimental and simulation techniques, we propose a methodology to simplify the modelling and finite element analysis process, which allows us to adjust the simulation parameters to certain values, depending on the internal filling geometry, resulting in an accurate prediction of the behaviour of parts printed in PLA subjected to bending.
Keywords
Additive manufacturing, 3D printing, fused deposition modeling, infill geometry, flexural properties, finite element analysis
Recibido/received: 24/03/2024 Aceptado/accepted: 27/10/2024.
1. Ingeniería del Diseño. Universidad Nacional de Educación a Distancia (UNED). Calle Juan del Rosal, 12. 28040 Madrid. España.
Corresponding author (autor para correspondencia): Iván Prada. E-mail: iprada1@alumno.uned.es
1. Introduction
1.1. The infill in 3D printed parts
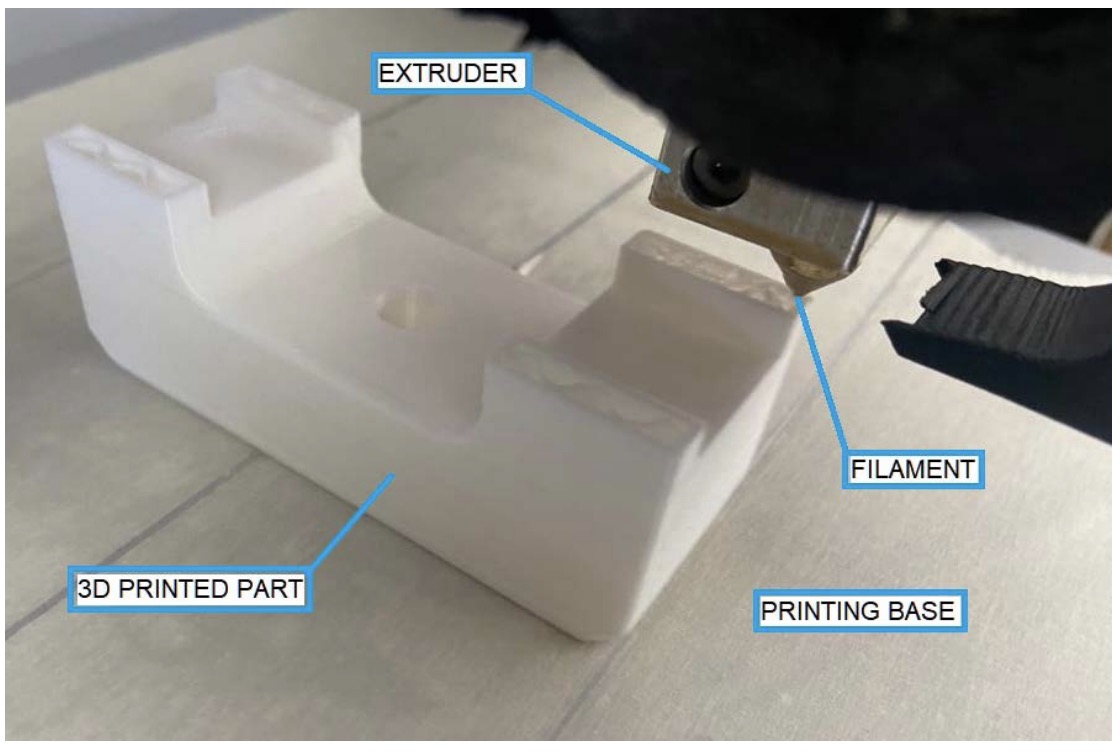
Additive manufacturing is the “process of creating or manufacturing a three-dimensional object directly from a model obtained by computer-aided design through layer-by-layer manufacturing” (Qamar Tanveer et al., 2022). Among the additive manufacturing techniques, the most common and widespread today is called fused deposition modelling (FDM), in which a thermoplastic material is heated to its semi-molten state and then extruded through a nozzle into a very thin filament, depositing it layer by layer to build the three-dimensional object (figure 1), following the trajectories defined by a file obtained from the computer-aided design software (File:Prusai3-metalframe.jpg – RepRap, s. f.).
The raw material is a continuous wire wound on a bobbin, with a diameter of approximately 1.75 mm, which passes through a feeder that takes it to the extruder nozzle, where it is heated and directed towards a base on which the wires are deposited in a state of semi-melt, which solidifies when it cools on a flat base. The following layer is placed on top of the first, and the two are welded together. The movements of the extruder head and the base are electronically controlled, allowing movements in the three X-Y-Z axes and the three-dimensional construction of the part (Fig. 1).
In traditional manufacturing processes you have control mainly of the outside of the part, but in 3D printed parts you can control very precisely both the outer walls and the inner filling of the object, which can contain a mixture of hollow and solid parts following a given geometry. The inner filling can follow any geometry that the software we are using allows us to select. By connecting to each other, and in turn connecting and joining the outer shell of the part, the different geometries or infill patterns provide different characteristics, such as lightness, greater resistance to certain loads, greater or lesser elasticity, among others. The filling density refers to the solid part of the inner structure of the part, and it is expressed as a percentage between 0%, i.e. the entire hollow interior, and 100%, which indicates that the interior is completely solid.
The infill percentage directly influences the amount of material used in its manufacture: the higher the percentage of infill, the lower the percentage of voids and, therefore, the heavier the finished part. The infill density also influences the printing time as well as the mechanical properties of the finished part.
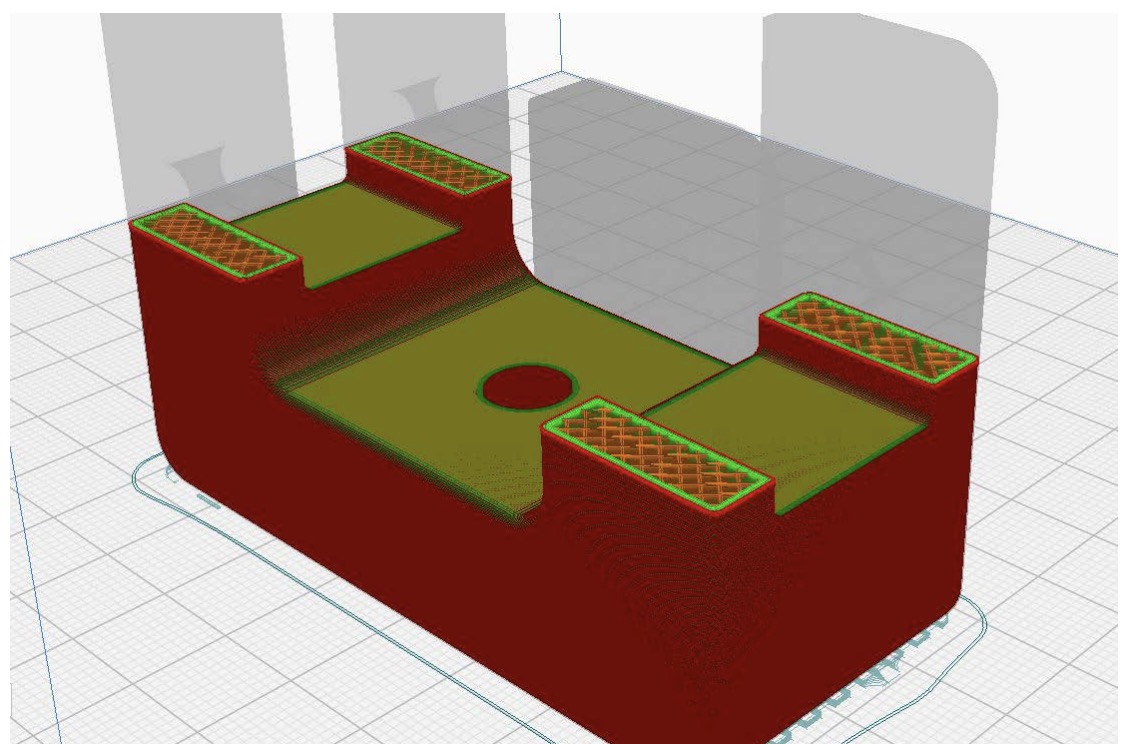
The following figure (Fig. 2) shows an example of the interior filling of a part, in orange, with a filling percentage of 30%, using the geometry called triangles in the Ultimaker Cura programme.
1.2. Flexural properties of 3D printed parts
Fused deposition modelling is a very useful alternative for manufacturing components with very complex geometries, which are quite difficult to produce using traditional methods. Although FDM was originally used to produce conceptual or aesthetic prototypes, with the development of new materials and techniques it is now possible to produce functional or real prototypes. The current trend is towards the manufacture of small series of fully functional parts, using materials in accordance with the mechanical requirements and the final function of the part.
The parts obtained by FDM are anisotropic, due to the layer-by-layer manufacturing process itself (Carvajal Loaiza et al., 2020). In addition, FDM additive construction can be configured to obtain parts that, while having the same external dimensions and using the same material, have different mechanical properties. This is achieved by modifying the parameters of the printing process (Stechina et al., 2020). Several studies carried out in recent years have attempted to characterise the mechanical properties of 3D printed parts (Hande Güler Özgül & Onur Tatl?, 2021), (Rosnitschek et al., 2021). In particular, it has been observed that the geometry and the density of the inner filling of the part are particularly relevant in the final behaviour of the part subjected to loads.
In order to be able to use 3D printed parts as functional parts, it is essential to be able to predict the final mechanical behaviour of the part to be used in a specific application. One of the most important aspects from a functional point of view is the flexural behaviour of the parts when subjected to loads during use in real situations.
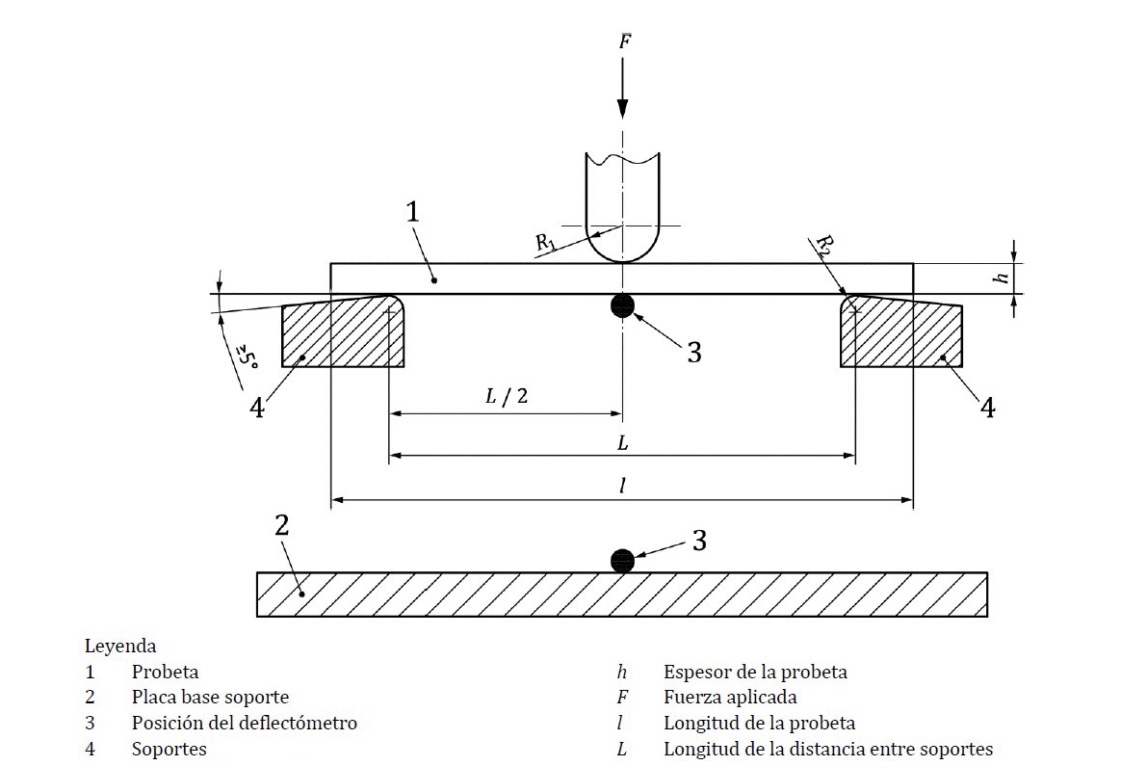
In the case of MDF manufacturing, there are currently no specific standards or methods for the experimental study of the bending behaviour of these parts. Some studies (Stechina et al., 2020) recommend following the guidelines of UNE-EN ISO 178:2020 Plastics. Determination of flexural properties (UNE-EN ISO 178:2020 | Normas AENOR, s.f.), by means of a three-point flexural test on a series of specimens (Fig. 3).
1.3. Finite element analysis
Finite element analysis (FEA) is a computer-based method for predicting the reaction of a product to forces, vibration, heat, fluid flow and other physical effects under real-world conditions (Software de análisis de elementos finitos, Autodesk, s.f.). This virtual analysis shows whether the part will break, deform or perform as intended. It is, therefore, used to predict what will happen when the product is used in real conditions.
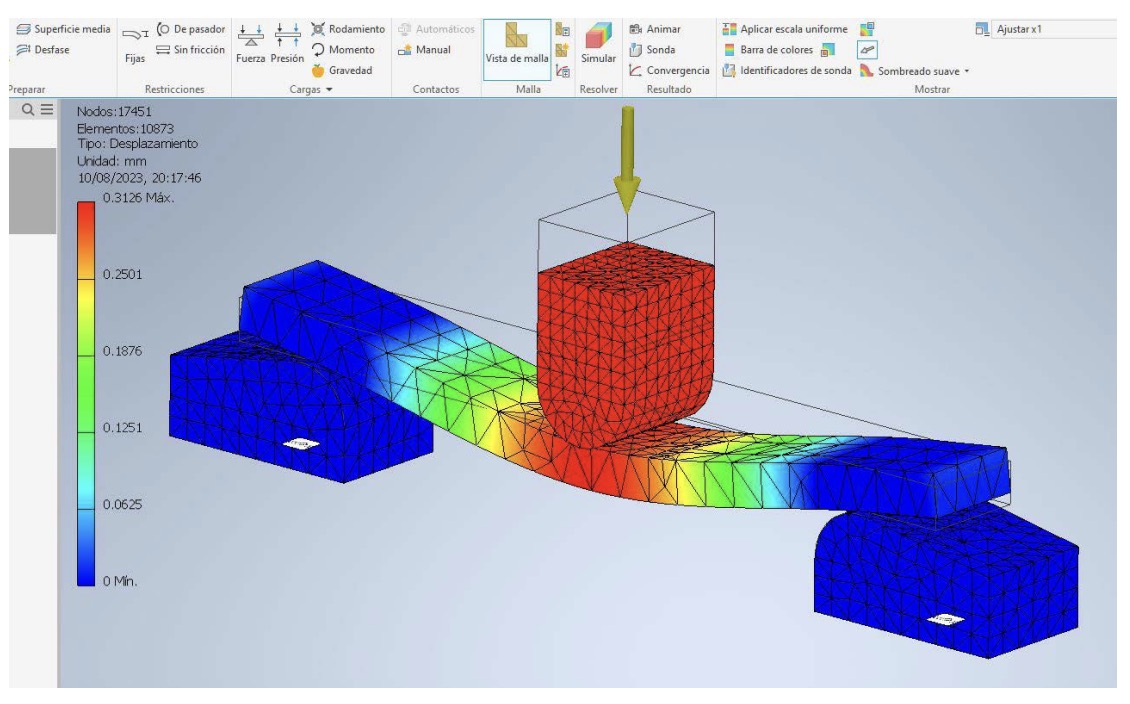
To perform this analysis, the software applies the finite element numerical method, decomposing the virtual object into a large number of finite elements, i.e., small cube or pyramid-shaped parts, and then approximately solving differential equations associated with the physical behaviour of the problem. In this way, the program calculates the displacements, deformations and stresses of the individual elements, and it is able to predict the behaviour of the real object (Fig. 4).
To obtain accurate results, all the variables of the problem must be correctly defined in the programme: from the correct definition of the materials used and their physical properties, the movement restrictions of the geometry to be studied, the external loads to which the object is subjected, the contact conditions between the elements involved, the density of the mesh in which the objects to be studied are decomposed, etc. The correct configuration of the simulation will give reliable results that serve to correctly predict the behaviour of the physical part under real conditions.
On the other hand, finite element analysis can require powerful computer equipment and the use of a lot of modelling and calculation time during the simulation, which is greater the more complex the geometry and conditions of the system to be studied.
2. Methodology
2.1. Objetives of the study
This work has had two main objectives. Firstly, to evaluate the finite element simulation process and the results obtained with a commonly used software, such as Autodesk Inventor, to predict the flexural behaviour of parts obtained by fused deposition modelling in PLA, depending on the geometry of the infill of the part. The second objective has been to find a methodology that simplifies and speeds up the modelling and simulation process of the virtual parts, and that allows reliable predictions to be obtained of the bending behaviour of the parts, with different configurations of the inner filling of the same. In other words, the aim is to find a way of simulating 3D printed parts, configuring the programme parameters and assuming some simplifications, which will help us save modelling and simulation time resources, but at the same time we will obtain reliable predictions of the mechanical behaviour when we subject the real physical parts to bending loads.

2.2. Experimental analysis: flexure testing of physical specimens
An experimental analysis (Fig. 5), which is not the subject of this article, has been carried out to evaluate the flexural properties of PLA specimens manufactured by FDM with a lowcost printer. In this study, specimens constructed with infills of different geometries and densities are compared in order to relate how the modulus of elasticity in flexure is modified by different configurations of the geometry of the infill of the part. Three-point bending tests were carried out on 10 × 4 mm rectangular section specimens of 80 mm length, supported at a distance of 64 mm between supports. Both the force applied to the central section of the specimen and the resulting deflection in this section were measured. For this article, we will use the results obtained for the fill pattern “lines” of the Cura program, with fill densities of 0%, 20%, 40%, 60%, 80%, and 100%.
2.3. Preparation of the virtual model
FDM manufacturing begins with the modelling of the part in a computer-aided design program, such as Autodesk Inventor, Solid Works, Freecad or others, with which we obtain a file of the model, which are converted into STL format (standard tessellation format) containing the geometric information of the model.
A program is then used to convert the geometry of the STL files into superimposed layers, which define how the three-dimensional model is constructed according to the adjustment of the different parameters according to the additive manufacturing technology used. These programs are called slicing programs for 3D printing and are able to generate command lines in so-called “G-code” that the 3D printer is able to read. The most widespread slicing programs for use with low-cost home 3D printers are Ultimaker’s Cura, PrusaSlicer or OctoPrint, among others (Los mejores programas para impresoras 3D de 2023, 2023). Once the part has been manufactured, some post-processing may be necessary to improve its strength or functional properties (Domínguez et al., 2013). The following schematic summarises the additive manufacturing process (Fig. 6):

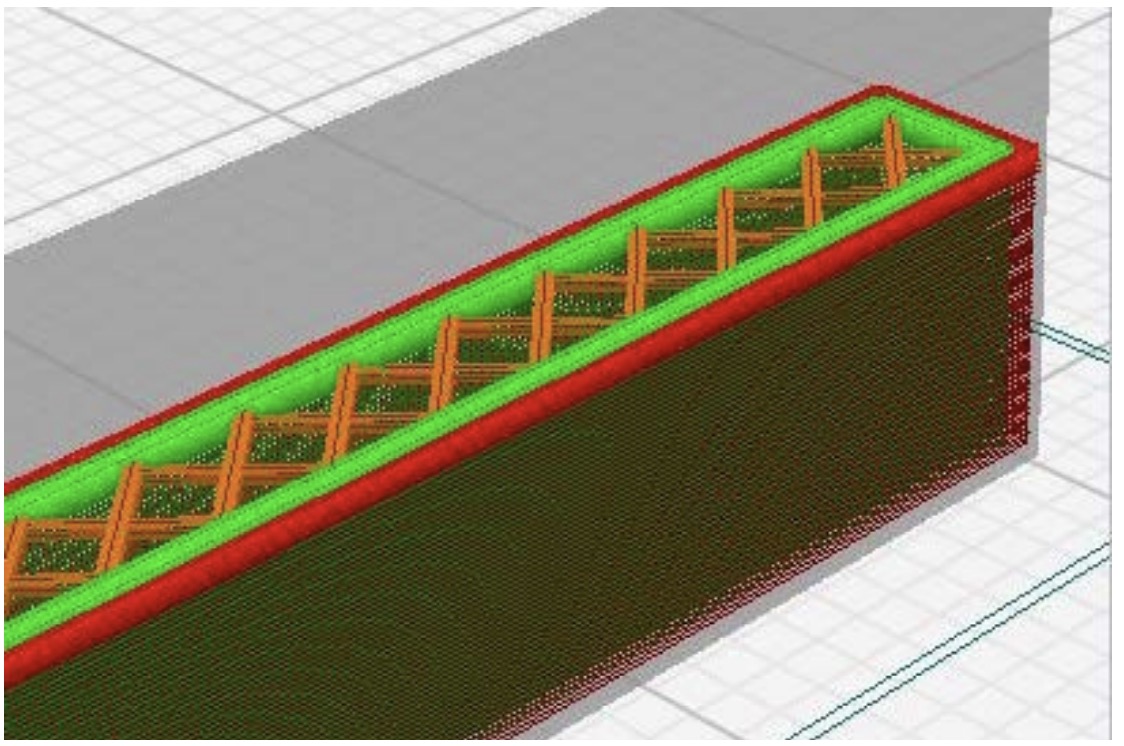
The slicing program is able to perform different types of infill of the part, modifying the parameters of the infill geometry and the infill density, so that the constructed part will have an infill of a given geometry. In the following figure (Fig. 7), as an example, the fill configuration called “lines” is shown in the Cura programme, with a density of 20%:
In order to carry out the virtual modelling of the part in the simulation program, both the outer casing and the inner filling should be modelled, with the complex geometry existing in the interior. However, at present, there is no software capable of converting the “G-code” programming, which, as explained above, contains the precise information on the geometry of the part, both inside and outside. Although some software applications, such as “gcode2l” (gcode2l, s.f.) are able to retrieve the information of the outer geometry, they do not reproduce the infill in any way, resulting in completely solid parts.
Therefore, if you want to accurately model the inside of the infill geometry of the part, you need to do it directly by studying how the specific geometry of the infill pattern is and how it varies with the percentage of infill. This modelling, except in very simple cases, will require a lot of modelling time and will result in a very complex virtual model.
2.4. Specimen modelling with the “lines” infill geometry
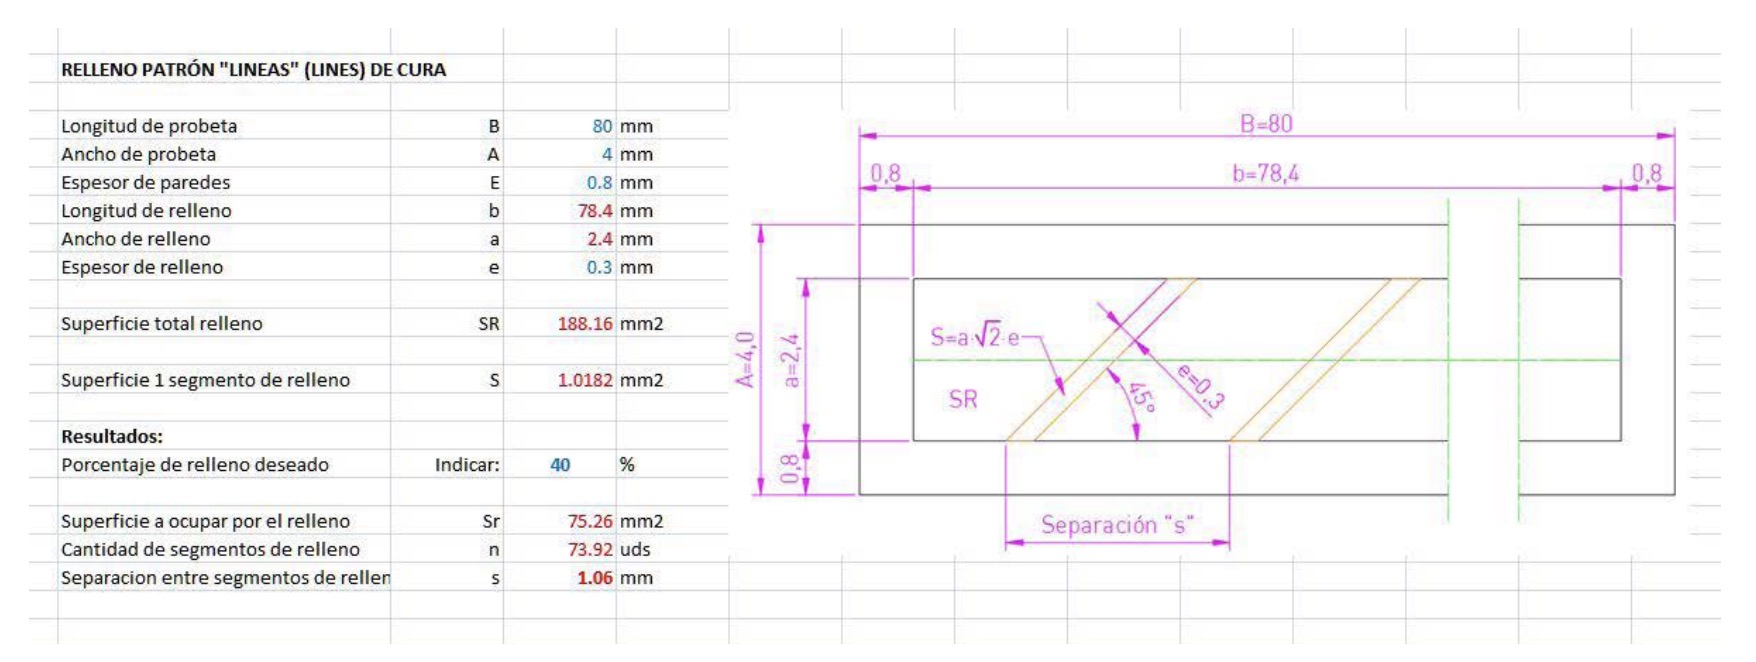
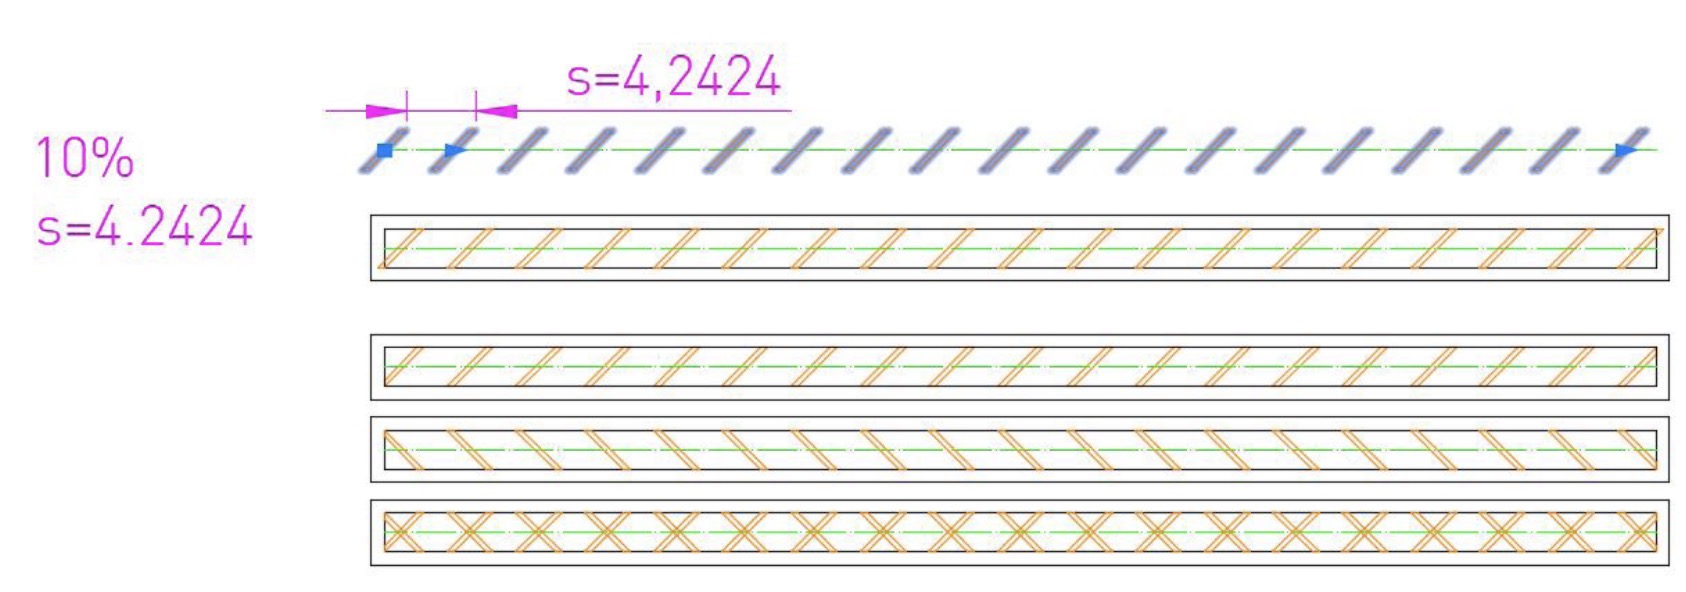
The Cura “lines” infill pattern contains lines printed in one direction along the X or Y axis every other layer, with the following layer being placed on lines perpendicular to the previous ones. The thickness of the fill lines is always the same, and as the infill percentage increases, more lines are added, evenly distributed, until the total space is filled with the percentage of 100%. This pattern can be modelled in Inventor in a relatively simple way. For this article, we first made a datasheet to obtain the exact distribution of the infill lines according to the indicated percentage, and then we sketched in AutoCAD the surface occupied by each of the layers, and finally we took this pattern to Inventor and modelled the inner infill area, in this case with a percentage of 20%, with layer thicknesses of 0.1 mm. The outer walls of the specimen are always 0.8 mm thick (Fig. 8):

2.5. Creating PLA material in Autodesk Inventor
The Autodesk Inventor program does not have PLA (polylactic acid) plastic among its standard materials.
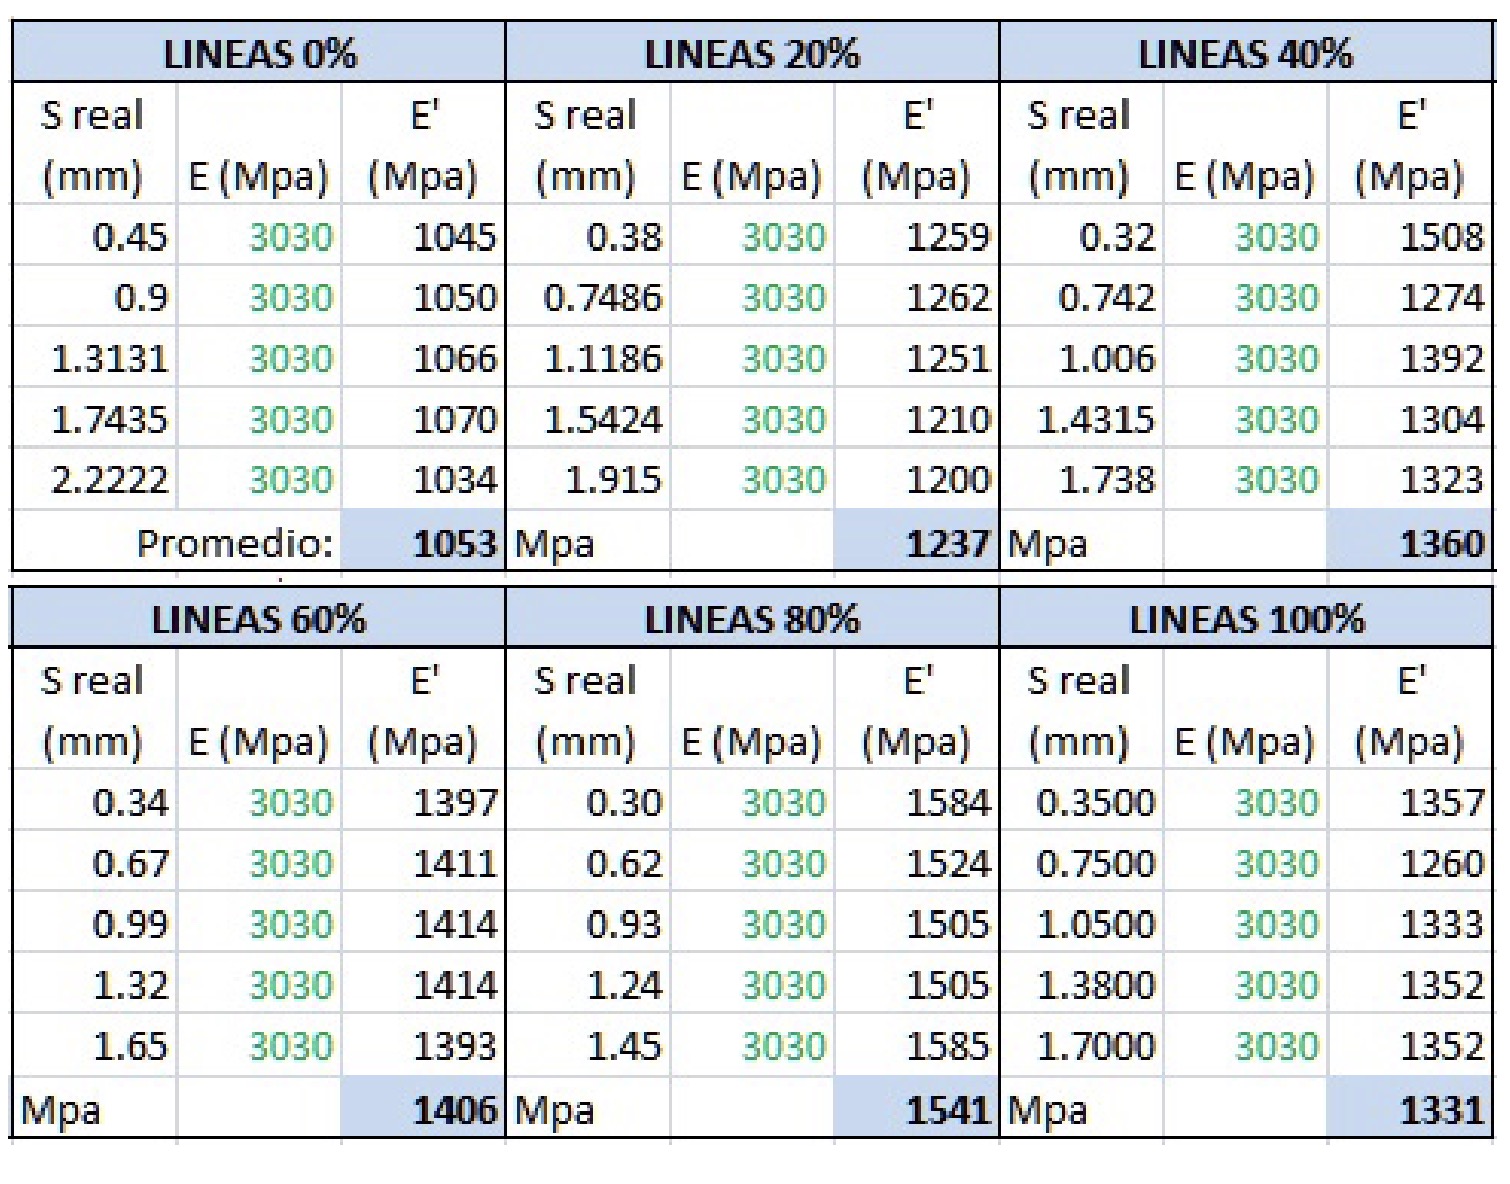
Therefore, it must be created with the material editor as a new material, defining mainly the values of: bending modulus or Young’s modulus (E), Poisson’s coefficient ( ) and shear modulus (G). The values of the base material of the PLA filament should not be used initially, as this would not reflect the transformation process of the material during layer-by-layer printing. Therefore, we start from the results obtained in the tests of real PLA specimens, which gave us the flexural modulus of elasticity in MPa, which can be considered as an approximation of Young’s modulus (E).(UNE-EN ISO 178:2020, Normas AENOR, s.f.). For the case of the pattern “lines” we obtained (Table 1):
Poisson’s coefficient is taken as 0.42 as described in the work of F. Rezgui. (Rezgui et al., 2005), and the value of the shear modulus G is obtained from the relation:
 Finally, the material is defined as isotropic, although we know that its behaviour is not, it is a simplification that we will make in order to speed up the simulation process.

2.6. Simulation of models with 0%, 20%, and 100% infill percentage
After modelling three specimens with infill “lines” and percentages of 0% (hollow), 20% (with infill “lines” modelled at 20%) and 100% (completely solid), we proceed to simulate in Inventor the three-point bending of the virtual specimens (Fig. 9). For this purpose we take into account the following conditions in order to faithfully reproduce the real test conditions:
•A support is modelled with two supports located 64 mm from each other, with a cylindrical contact surface with a radius of 5 mm with the specimen. The central loadbearing support is also modelled in steel, located in the central area between the two lower supports, and also with a contact radius of 5 mm with the specimen.
•The two lower supports are set as “fixed”.
•The load is placed on the flat face of the upper part, vertically (Z-axis) and downwards.
•The virtual specimen is placed on the two supports, with the load-bearing part making contact in the centre of its upper face.
The simulation process is repeated five times for each of the three specimens, with loads of 10 N, 20 N, 30 N, 40 N, and 50 N. These loads are taken as being in the range of those used during the experimental test with real specimens. These loads are taken as they are in the range of those used during the experimental test with real specimens. In each of the simulations with Inventor, the maximum displacement in the Z axis of the bottom face of the specimen is taken. In this way, we obtain displacement values as a function of the applied load (Fig. 10).

“lines” filling at 20%.
During the simulation, the modelled specimen with 20% infill caused a great slowdown in the calculation, due to the complexity of the infill geometry which results in a huge number of individual elements and calculations in the finite element analysis. The calculation process took between 30 and 40 minutes for each of the applied loads. However, for the 0% or 100% infill specimens, with a very simple geometry, the calculation process took less than 1 minute.
The following graphs (Fig. 11) show the results after the simulations in grey, together with the results obtained experimentally with the real physical specimens and the three-point bending tests. It can be seen that the results obtained are far from reality, in all cases the virtual specimens deform less than the real ones under the same loads, so that the analysis carried out by the simulator is not valid for predicting the bending behaviour of the parts. In addition to the high consumption of time and resources that has been mentioned above.


2.7. Alternative method to improve simulation results
In view of the above results, and in view of the enormous amount of time spent on modelling and simulation for parts of low complexity such as these specimens, it is necessary to establish a methodology that simplifies the simulation process and, at the same time, achieves satisfactory results, comparable with the results obtained experimentally with real physical specimens.
On the one hand, the virtual part will be modelled as completely solid, regardless of whether we are trying to simulate a partial or total infill percentage, without differentiating between the outer walls and the inner infill. This simplification saves an enormous amount of time analysing the infill and modelling it, and greatly simplifies the geometry of the virtual model, as it becomes a solid and homogeneous rectangular prism in all cases.
On the other hand, it is observed that the virtual specimens deform less than the real specimens, the bending deformation being inversely proportional to the modulus of elasticity of the material (Budynas & Nisbett, 2011). The elastic equation for a beam biaxially supported between the points A and C as in this case, is determined by:
 The maximum deflection in the centre section is:
 In the finite element simulation, these equations are present and, therefore, by properly configuring the parameters that define the virtual material, we can adjust the behaviour of the simulation to obtain accurate results that are adjusted to the real behaviour of the part. For this purpose, we take as a reference the deformation values of the real specimens produced for the load values of 10 N, 20 N, 30 N, 40 N, and 50 N. We interpolated to find these values when we do not have exact data for these loads. We took the modulus of elasticity of the real specimen with 100% infill, which experimentally we obtained a value of 3030 MPa. We compared the deformations of the physical specimens with the deformation of the virtual specimen with 100% infill, i.e. the fully solid modelled specimen. The corrected value E’ for each of the strain cases will be:
 3. Results
3.1. Calculation of corrected PLA properties
We applied the calculation procedure described above for each of the infill percentages studied: 0%, 20%, 40%, 60%, 80%, and 100%, obtaining the following values of corrected modulus of elasticity E’ (Table 2):
Once we have the corrected modulus of elasticity values E’, we obtain the corrected shear modulus values G’, and we proceed to enter these values in the creation of new PLA plastic materials in Inventor (Table 3):

3.2. Simulations with corrected PLA properties
With the materials defined in Inventor according to table 3 above, we proceed to repeat the simulations, under the same conditions as explained in section Simulation of models with 0%, 20%, and 100% infill percentage, but applying the corrected material for the infill pattern lines and infill percentages 0%, 20%, 40%, 60%, 80%, and 100% to the specimen. For each of the new materials, simulations are carried out with loads of 10 N, 20 N, 30 N, 40 N, and 50 N, noting in each case the maximum deformation suffered by the specimen on its lower face.
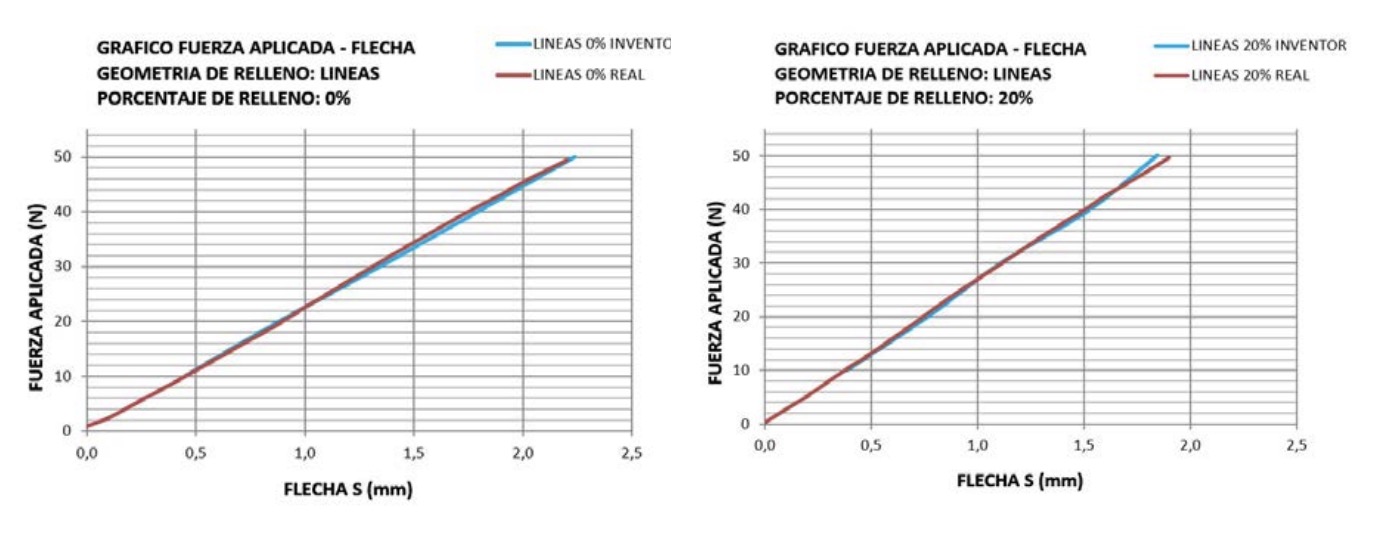
infill 0% (A), 20% (B).

infill 40% (C), 60% (D).
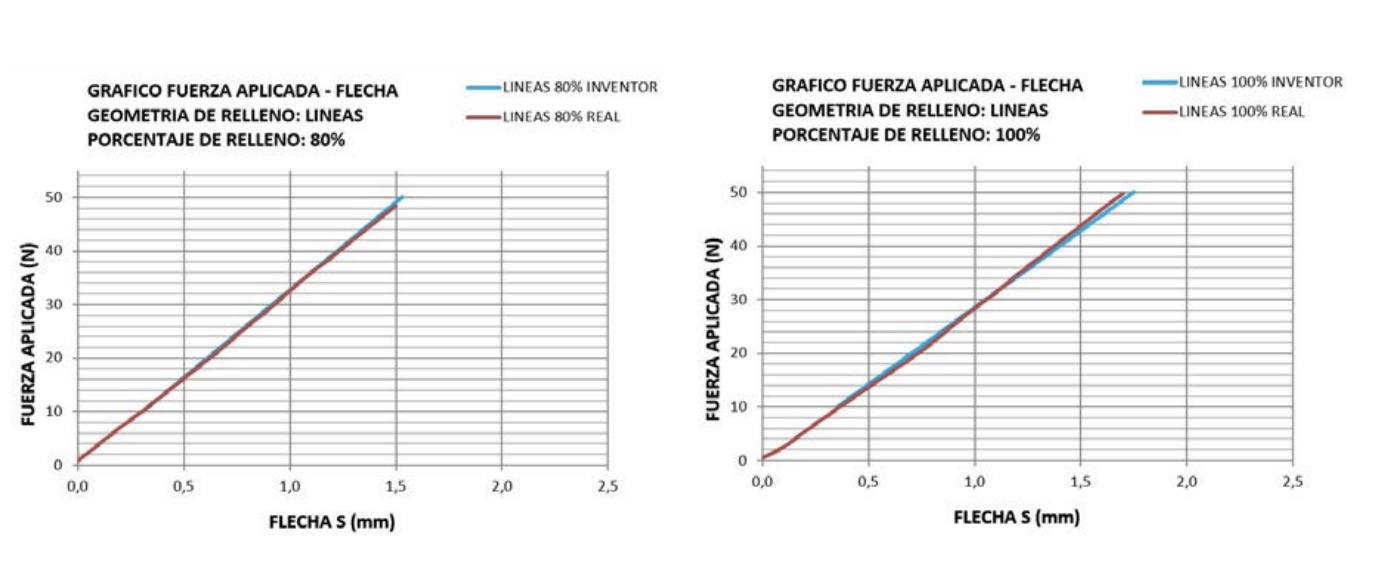
infill 80% (E), and 100% (F).

and corrected values for a specimen with 100% infill percentage.
The results obtained are shown in the following graphs (Fig. 12): Comparatively, the following graph (Fig. 13) shows the difference between the actual values of the physical specimens with 100% infill, with the initial simulation with the initial materials E and G, and with the corrected values E’ and G’ according to the proposed method: 4.
Conclusions
Fused deposition modelling, and additive manufacturing in general, results in parts with anisotropic behaviour, due to the layer-by-layer manufacturing process itself, which means that the part does not have the same properties in all directions. This particularity means that virtual simulations of 3D printed parts, carried out using finite element programs, give results that are not expected or that do not coincide with the behaviour of the real part. Although finite element analysis is a reliable procedure that provides accurate results in conventional materials, in order to be able to predict the real behaviour of a part obtained by FDM, with all the geometric complexity that it implies, a huge amount of modelling and preparation time would have to be spent to carry out the exact simulation of the geometry, both internal and external, of the part. Simulation programs, such as Autodesk Inventor, also have the ability to perform complex configurations to simulate materials that do not have the same properties in all directions, but this, in turn, requires a great deal of analysis time and subsequent high calculation times, while powerful computer systems are needed to solve the simulations.
As the parts obtained by FDM have, in addition to the outer geometry, an inner infill of very complex geometry, trying to make an exact simulation of this geometry involves a high level of modelling and computer calculation time, which is not feasible with conventional computer equipment.
To solve this problem, in this work we have proposed a methodology that, assuming some simplifications, allows us to obtain very accurate results in the simulations carried out by finite element analysis on PLA elements subjected to bending. By correctly defining the parameters of the materials, we are able to obtain very accurate results of the behaviour of the part, with the help of a previous experimental analysis. The great advantage of this method is that it eliminates the modelling of the inner infill of the part, whose geometry is very complex, being able to simplify the modelling to the outer geometry, and leaving the inner part completely solid. This saves a considerable amount of modelling time and subsequent analysis. This method is able to predict very accurately the bending behaviour as a function of the different percentages of the infill. The study has been carried out for the infill pattern called “lines”, but it can be done with any other pattern or interior geometry available.
In view of the results obtained, it can be affirmed that this methodology is valid, and allows to accurately predict the flexural behaviour of PLA parts obtained by fused deposition modelling with different infill patterns and densities. Future work can apply this methodology to corroborate the results with other additive manufacturing techniques, or other loading situations such as tension, compression or torsion. Studies such as the present one will help additive manufacturing technologies to be used to produce fully functional parts. Just as in metallic materials, manufacturing and performance standards were reached for the different alloys, in the future the materials used for additive manufacturing should go through processes of standardisation of mechanical properties and standardisation of manufacturing procedures, so that designers can correctly choose the material and the process to follow in order to obtain the expected mechanical response.
References
Budynas, R. G., & Nisbett, J. K. (2011). Shigley’s mechanical engineering design (9th ed). McGraw-Hill.
Carvajal Loaiza, M. J., Gónzalez Diaz, P., Mejía Blandón, C. A., Bustamante Góez, L. M., & Villarraga Ossa, J. A. (2020). Influencia de la posición de impresión y la densidad de relleno en las propiedades mecánicas de probetas fabricadas en ABS. Revista Ingenierías Universidad de Medellín, 19(37), 179-193. https:// doi.org/10.22395/rium.v19n37a9
Domínguez, I. A., Romero, L., Espinosa, M. M., & Domínguez, M. (2013). Impresión 3D de maquetas y prototipos en arquitectura y construcción. Revista de La Construcción, 12(2), 39-53. https://doi.org/10.4067/ S0718-915X2013000200004
File:Prusai3-metalframe.jpg—RepRap. (s. f.). Recuperado 2 de abril de 2023, de https://reprap.org/wiki/ File:Prusai3-metalframe.jpg
Gcode2l. (s. f.). gcode2l.com. Recuperado 11 de agosto de 2023, de https:// gcode2l.com/login
Hande Güler Özgül & Onur Tatl?. (2021). Caracterización mecánica de materiales impresos en 3D de polímero de ácido poliláctico: Los efectos de la geometría del relleno. Revista de Metalurgia (Madrid), 57(3). https://doi.org/10.3989/revmetalm.202
Los mejores programas para impresoras 3D de 2023. (2023, febrero 6). All3DP. https://all3dp.com/es/1/ programas-software-impresora-3d-printer-software-3d-gratis/
Qamar Tanveer, M., Mishra, G., Mishra, S., & Sharma, R. (2022). Effect of infill pattern and infill density on mechanical behaviour of FDM 3D printed Parts- a current review. Materials Today : Proceedings, 62, 100-108. https://doi.org/10.1016/j. matpr.2022.02.310
Rezgui, F., Swistek, M., Hiver, J. M., G’Sell, C., & Sadoun, T. (2005). Deformation and damage upon stretching of degradable polymers (PLA and PCL). Polymer, 46(18), 7370-7385. https://doi.org/10.1016/j.polymer.2005.03.116
Rosnitschek, T., Seefeldt, A., Alber-Laukant, B., Neumeyer, T., Altstädt, V., & Tremmel, S. (2021). Correlations of Geometry and Infill Degree of Extrusion Additively Manufactured 316L Stainless Steel Components. Materials, 14(18), 5173-. https://doi.org/10.3390/ ma14185173
Software de análisis de elementos finitos | Autodesk. (s. f.). Recuperado 9 de agosto de 2023, de https://www. autodesk.es/solutions/finite-element-analysis
Stechina, D., Mendoza, S. M., Martín, H. D., Maggi, C. N., & Piovan, M. T. (2020). Determinación de propiedades elásticas de piezas poliméricas construidas por impresión 3D, sometidas a flexión. Matéria (Rio de Janeiro), 25(2), e-12617. https://doi.org/10.1590/s1517- 707620200002.1017
UNE-EN ISO 178:2020 | Normas AENOR. (s.f.). Recuperado 23 de julio de 2023, de https://tienda. aenor.com/norma-une-en-iso-178- 2020-n0063218.


